Every day we offer FREE licensed software you’d have to buy otherwise.
Giveaway of the day — TrendingBot lite
TrendingBot lite was available as a giveaway on April 15, 2009!


TrendingBot represents an alternative to the conventional data analysing software. It can be defined as an "equation seeker" or a "trend finder".
Three main features characterise its innovative algorithm:
- As detailed calculations as required (minimum number of simplifications possible).
- No user parameters.
- To-the-point solutions (directly applicable equation or "trend not found").
TrendingBot lite includes the latest version of trendingBot’s powerful algorithm, has no time restrictions and works with the following limitations:
- just 5 independent variables
- no full support/advising service
- no update service
You can also download the TrendingBot video tutorial.
Please note that TrendingBot lite is specially created for Giveaway Of The Day visitors and is not available on the publisher's website (the price is given for the full version of the product).
System Requirements:
Windows 2000, XP, 2003 Server, Vista; Microsoft Excel 2000, 2002, 2003, 2007; CPU: intel pentium 4 1.6 (2.2) GHz processor [or equivalent]; memory: 1 (2) GB; available hard disk space: 5 (10) GB
Publisher:
trendingITHomepage:
http://www.trendingit.com/index.htm?language=enFile Size:
14.6 MB
Price:
990 EUR
Comments on TrendingBot lite
Please add a comment explaining the reason behind your vote.

That'll teach me to check this site more than once a day. When I checked only the Reezaa MP3 convertere software (rerun) was up - now on the 16th I see this interesting software was available, too!!, but too late to download. Wish GOTD could get past these hiccups (the clock problem last week - had to go to other intl sites to download). Can't complain too much - have gotten a lot of great software!! Will have to keep watching - maybe Alvaro will give GOTD another try.
Save | Cancel
As said, I am not feeling very confortable by continuing writing here, we can continue this wherever you want.
For the things you are saying the capabities from this model can come close to the ones from trendingBot. Although the only way to know it is by testing it. Propose any set and we can try both approaches. Or better, tomorrow I can check the raw data for the case study you are referring, feeding in my program and check the result.
Nevertheless, note that a capital difference between both (before confirming that actually the calculation capabilities are equivalent) is that trendingBot does not need to be warned about something getting more or less complex. Its algorithm is capable of dealing with any set (the simplest or the most complex one) an give a SENSIBLE answer; overfitting is just the consequence of a stupid understanding: trendingBot is capable to understand (= is not stupid = seldom shows overfitting). The fact of taking into account all the variables every time does not mean to be incapable of dealing with them in a proper way (= avoiding overfitting at any cost).
You can use the contact form in our webpage and let me know about some way to contact you or propose a public forum to share the results or whatsoever you propose; and we can test both programs undertanding capabilities (from some statement in the link you gave making a reference to a really high number of independent variables, drives me to think that this program's algorithm is not equivalent to trendingbot's (around 20 independent variables would virtually saturate any nowadays computer (and would take really long time to be processed)))... Nevertheless, I don't want to show an attitude equivalent to the one from those I have critised: I want to try it.
And this is the last post I will write here (except for the case of proposing any other public forum)
Save | Cancel
#108, alvaro, read the Retail Store Profitability model example and the user manual. You specify the dependent variable among the (typically multiple) independent variables, and specify other parameters, such as number of multiplicands and exponent ranges, and it will automatically or manually select the best term among the top ten to add or drop after each iteration (automatic mode continues until it can't). The reason this wasn't fully automated is made clear in the user manual. Starting with a simpler model and only increasing the complexity as warranted will greatly reduce the likelihood of over-fitting and instability in the result model, as well as alerting the user to problems with the dataset (outliers, etc.)
Save | Cancel
and this was all...
I have answered the posts including ideas I considered much important to make clear in order to understand the whole picture (and some others just having a so censorable attitude that I wasn't able to refrain from saying something).
Thanks for all the nice comments, feedback, advices, "i understand your situation" statements...
GAOTD has provided me an excellent opportunity to get noticed and learn a lot and I can not pay them back by continuing writing things here as it would be a standard forum, distracting the attention from their main bussiness.
Anyone can contact us directly and if you are interested in make it public somehow, we are completely open to any suggestion (going to some specialised forum or creatin one for our webpage...).
Have a good day and thanks to everyone.
Save | Cancel
92.From what I can glean from what I’ve read within these comments and some of the materials that have been cited as references, I gather that:
1. The output is in the form of an equation that is completely deterministic, without any estimate of predictive uncertainty. That is, no statistical prediction intervals for the output (dependent) variable.
2. Independent variables are assumed to be totally uncorrelated. (Correlations among independent variables can result in highly unstable models.)
3. It is unclear as to how TrendingBot “decides” when it has chosen “enough,” but not “too many” independent variables. (One can increase R^2 simply by adding independent variables, but larger values of R^2 only mean better fit to existing data…it does NOT mean better predictive power. Indeed, parsimony in the number of independent variables and number of estimated parameters is a GOOD THING. That is, Occam’s Razor applies: Use as many as needed to achieve good (predictive) results, but use no more.)
In the Statistics.pdf reference [ http://www.trendingit.com/docs/en/Theoretical_overview/1-Statistics.pdf ], it is stated that “no behaviour (no one worthy to be predicted) can be described by attending at a so low number of variables.” Thus it seems that TrendingBot rejects the idea of parsimony.
4. In the same pdf document, it is admitted that TrendingBot cannot deal with stochasticity: ‘trendingBot’s result for any (stochastic) time series = “trend not found”‘
5. As a general rule, if one is building a completely deterministic model (with all probabilities ignored), then one should first determine the model form. For example, in 1964, when DuPont wanted me to build a deterministic, predictive model of the output of “waste nylon” from a new manufacturing process, I went down to the factory floor, WATCHED, and ASKED the workers what they did and how they decided what values to put into their data sheets. [The industrial engineer, mechanical engineer, and foreman all were wrong about how the operation worked.] I then constructed a mathematical model based on how the process operated and how the data were determined. I then used the existing data to determine the parameters and checked to ensure that the model’s input variable historical data generated the actual output variable historical data.
5. The aforementioned pdf document states:
5a. “although there are no essential differences between extrapolation and interpolation methods…” YES THERE IS: OOne interpolates between values, one extrapolates beyond existing values.
5b. In the section, “b-5 probability-related methods [randomness],” it is stated that “these methods do not predict future behaviours on the basis of past ones [effects on the dependent variable from variations in the independent one(s)], but the probability of an event [= invariant phenomenon = not describable as a result of the interaction between independent/dependent variables] to occur.” This is not true. For many years I developed stochastic (probabilistic) models that predicted future values, WITH ESTIMATED PROBABILITIES OF OCCURRENCE or, more accurately, WITH PREDICTION INTERVALS for the predicted future values and associated PROBABILITIES that the predicted values would lie within the intervals.
_________________________________________________________________
You seem to be a quite devote defender of old methods, so I am having the impression that this will be tough (from your side and from mine).
1. You are right -> it intends to rely on the common sense and on the personal experience of anyone (and anyone's work). As a rough estimation, we say that if the feeding is higher or equal than 30 cases and the resulting mean error yields below 5% (if lower, much better), the introduced behaviour has been quite properly understood and, hence most likely the resulting prediction would be quite accurate; how long? It depends completely upon the situation. That is, we are not intending to teach anyone how to do their jobs, but helping them (higher understanding over data), improving their knowledge. The final decision and the right application of this knowledge can only be given by an experienced person on this specific field.
2. Again, you are right. They are assumed to be uncorrelated because this is the way the would be relevant in order to describe the behaviour from a mathematical point of view. Too similar independent variables = the model will consider in the best scenario just one of them.
3. In this point, your ideas are not clear enough: trendingBot does not decide what variable should be chosen; it considers ALL OF THEM.
Short ideas:
a) Detailed combinatorics (all the possible combinations among all the possible number of variables raised to different exponents) -> millions of combinations, let's call them: x1(i)
b) Regression part -> (2nd degree) polynomial are performed, taken as independent variable any of this x1(i) and as dependent the corresponding output. Note that this analysis is being performed for every single case (or training point)
c) Decision sub-algorithm -> the differents fits (again various millions) are validated against the given data (all the cases) and only the best one is chosen. Additional note here: trendingBot considers as a trend any fit that, after being applied to all the given training set, shows a (relative) error = it is considered that the behaviour has been more-or-less properly understood and certain forecasting capabilities are assignated to this specific fit.
I don't know what is the idea of parsimony; with this statement I meant that although the regressive analysis is the most adequate method for data understanding, its application is really restrictive (extending it is precisely the idea behind trendingBot).
4. No. It can (and should) not. After reading above how a trend is determined (low error for the most of the training points), you would come to the same conclusion. Understanding the point properly: certain level of randomness, yes (everything is quasi-random) but essentially-random behaviours, no (random = impossible to be predicted, then what would be the point of using a self-called predictor?).
5. I think this point has been answered above: the program just provides some help, let the final decision to the user.
5a: This statement does not reflect the intention of the writing: I know the difference between interpolation and extrapolations, and consider the latter as the last resource; I meant that the method required to perform a interpolating regression or a extrapolating one shoud be almost identical because the underlying problem is basically the same. Nevertheless this was a completely secondary comment (I don't know anything about extrapolation methods) having sense within the rest the text but I am not understanding what is its importance to be highlighted here.
5b: random means impredictable, once you can somehow predict it has implicity convert its essence into forecastable and thus not randomb/stochastic. Have you got it though stochastic means? Good for you but them you shouldn't continue calling this behaviour random: was random when it was impossible for you to understand it, once this problem has been overcome, its characters changes.
Save | Cancel
107.alvaro, I read your forum thread and compared what you state trendingBot does with Simetrica TaylorFit. trendingBot is more automated, but appears to have far fewer features than TaylorFit. Which returns quicker results, someone would have to test. As I don’t have Excel installed, I can’t test trendingBot, and I didn’t notice a trial version of TaylorFit. Which is quicker is only relevant if the calculation time is excessive; it’s the results that count. According to your post #98, you “haven’t read or followed a single technical paper at any point”. The issues which would be relevant to me if I needed this sort of software, are that Simetrica is extremely open about their algorithms, alternatives, and the good and bad points of each. They have an established product at a much lower price, which doesn’t require Excel, with example applications, potential applications, and big-name client case studies. They publish TaylorFit’s user manual, which contains very valuable information on modeling, in addition to the extensive information on their website. The opposite of your research approach, they publish a bibliography of the papers and books which they referenced when developing TaylorFit. They correctly point out that a fully-automated modeling approach can have very undesirable consequences. Users should not blindly turn modeling over to an automated system, but should carefully examine the data and models at each step, i.e., the user must have some competence in data analysis and modeling. Actually, the user needs to be very careful even in terms of selecting the data, and potentially performing some pre-processing. TaylorFit does have fully-automated modes if one wants to use those.
---------------------------------------------------------------
(small pause on the accumulated-posts answering)
I think the differences are quite straighforward (please, if you haven't test it, don't say that their performances are equivalent these is really for from true). After a quickly skimming through this page, I know what is about: it is a simple regression analyser. All the examples you can see there involve just 2 variables: 1 dependent vs. 1 independent. For example, time series: whatever value (dependent) vs. time. This really-limited lite version does something on the lines of this program (data->result) but for 5 independent variables, I thought this issue was clear enough.
For example: one of the blind test someone propose me yesterday consisted in different assets (equity bounds), each of them being defined by 4 variables (total, prem, last & vol); trendingbot found a trend easily predicting them during 1 year with a resulting error of 4%. How could deal the program you say with such a problem? Answer: it can not, because traditional regression analysis can not.
You don't have excel? I will try to sort out this issue ASAP (right now working with OO). Until them why not accepting our challenge? (in our webpage): send us any set of data and get the solution; then, apply the program you say and update this forum with the result. What do you think?
PS: am I the only one experiencing a bit weird behaviour of this forum during teh last hour? Right now it is going really slow (almost not able to see what I am writing).
Save | Cancel
alvaro, I read your forum thread and compared what you state trendingBot does with Simetrica TaylorFit. trendingBot is more automated, but appears to have far fewer features than TaylorFit. Which returns quicker results, someone would have to test. As I don't have Excel installed, I can't test trendingBot, and I didn't notice a trial version of TaylorFit. Which is quicker is only relevant if the calculation time is excessive; it's the results that count. According to your post #98, you "haven’t read or followed a single technical paper at any point". The issues which would be relevant to me if I needed this sort of software, are that Simetrica is extremely open about their algorithms, alternatives, and the good and bad points of each. They have an established product at a much lower price, which doesn't require Excel, with example applications, potential applications, and big-name client case studies. They publish TaylorFit's user manual, which contains very valuable information on modeling, in addition to the extensive information on their website. The opposite of your research approach, they publish a bibliography of the papers and books which they referenced when developing TaylorFit. They correctly point out that a fully-automated modeling approach can have very undesirable consequences. Users should not blindly turn modeling over to an automated system, but should carefully examine the data and models at each step, i.e., the user must have some competence in data analysis and modeling. Actually, the user needs to be very careful even in terms of selecting the data, and potentially performing some pre-processing. TaylorFit does have fully-automated modes if one wants to use those.
Save | Cancel
88.The developer’s idea and application are good for its purpose but the positives are overshadowed by the lack of good presentation, website design, descriptions of features, documentation, and support.
Suggestions: Provide at least a basic outline in the text file that is with the prgram. Opening a text file to read the information in it and then finding only a link to a blog is annoying to say the least!
For a program whose full version has such a high price, I would advise using more formal terminology tham phrases such as “the whole thing.” Perhaps this is am attempt to be humorous but humor is rather out of place im a high-end business oriented application.
The stated requirements for 1 to 2 Gb of memory and 5/10 Gb of empty hdd space are too large for many people’s systems. Consider ways to reduce these requirements. Remember there are many MANY people running older slower systems with smaller hard drives. Remember too that many business people use laptops and most laptops hard drives are small compared to desktops of equivalent age.
The various exe, msi, and batch files sprinkled throughout the program’s folders are confusing as to what app is supposed to be for what purpose.
The website has very simple sketchy info. On the “about us” page, the “more about us” link merely reloads the same page.
The idea of a yahoo group is good, but when there is no activity at all and only links to “yahoo answers” math pages on the group homepage, the overall impression it gives is negative.
I suggest you spend some time looking at examples of both good and bad site design at these links:
http://www.webpagesthatsuck.com/
http://www.killersites.com/
http://www.worstoftheweb.com/
Top Ten Mistakes in Web Design
http://www.useit.com/alertbox/9605.html
Usability 101: Introduction to Usability
http://www.useit.com/alertbox/20030825.html
Some changes in presentation, good documentation and usage instructions, and a group or forum that has activity of some kind, will do a lot to improve the impression this application and its developer site gives to the public.
Good luck!
________________________________________________________________
Impressive feeback!
We have to work on all the lines you propose, but let me make some precisions:
- "the_whole_thing", the same as many others details try to give a "casual" image: young and funny, although professional. But perhaps you are right and this casualty should make a bit milder in order to avoid people confusing it with lack of seriourity.
- Regarding the requirements, quite little can be done on this front. Actually, they will follow an increasing progression (in parallel to the complexity of the algorithm). The basic idea is simplifying as less as possible = doing very much = very high (unfortunately unavoidable) computational expense.
- My intention after reading you comment was removing yahoo groups, although yesterday, we've got our first post.
- All your suggestions on the webpage front are really interesting, I have already let our webmaster know about them.
Thanks again.
Save | Cancel
87.I’m having a problem. I’m running Vista, downloaded and installed and activated application according to directions but on execution I see screen after screen of ‘file not found’ errors.
Although the description is sketchy, I’m intrigued. I’m a researcher and a SAS user. I’m disappointed that we are limited to 5 variables. I work with multivariate data, never with as few as 5 variables.
------------------------------------------
I am using Vista and can install the program without problems.
Regarding the multivariate systems I have writen about them in may posts: they are not considering all the variables at the same time or with the exponential variation my algorithm does. Either impose rigid inputs-systems (you have to measure this and this) or rely on lots of user-defined parameters, or give completely indirect answers (new variables giving an indirect idea about what is going on). Any of these multivariate systems will do the proposed problem here: give the data, run the sim and let the program try everything. If you have doubts, you can try with the most powerfull mathematical package: Matlab; its regression/curve fitting sub-package does allow a maximum of 2 independent variables (with no exponential variation and with user intervention (you say what to do)).
Save | Cancel
My personal comment regarding this parallel thread Microsoft/OO -> I think that this is much more relevant in the States than in Europe (here, the most of the people use Microsoft)
Save | Cancel
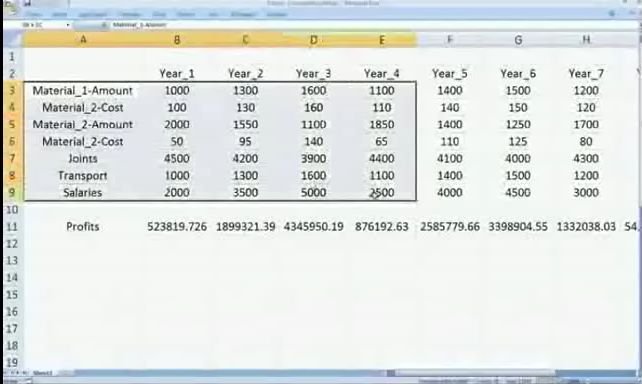
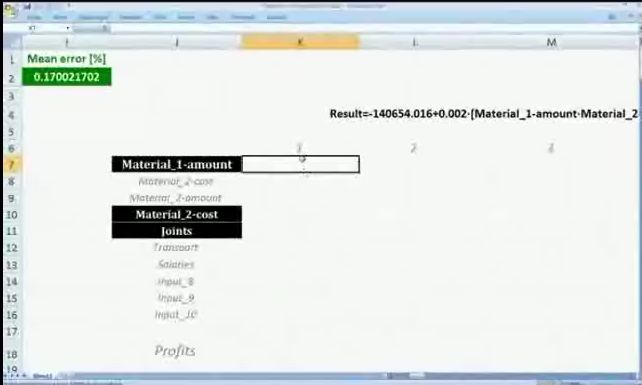
85.Let me see if I understand the purpose of this program.
Get a relation between various related inputs of data with relation of 1 output of data. This generates a set of weights that can be used to predict a value.
If for example (a very simplified one) you want Z and have X and Y
predicted Z = wx * X + wy * Y
Your program calculates the possible weights based on the data and uses them to create a formula in excel for it.
One thing I do not understand, is why not give the option of use .csv as the input and export the formula in plain text to the clipboard. That way it can be used not only in OpenOffice, but on any spreadsheet. Or even on a web page.
-----------------------------------------------------
No. It does not calculate weights at all.
Performs all the available combinations (many) -> comb(n) and then millions of polynomial regression are performed taking any of these combinations as the independent variable and finding out which one describes better the behaviour.
Regarding you second question: as said, I will ASAP increase the number of possible input-givers (other thing is the results: the communication FORTRAN-excel does the trick but I don't know whether there is such a libraries to OO or other platforms).
Save | Cancel
83.Alvaro, biggest question is if your system works and predicts correctly e.g. financial data, why dont you just shut up, keep this to yourself and make billions on the stock markets, rather than trying to sell software for $1000?
i checked the wilmott site too. it is not at all convincing, but rather a history of newly found bugs and exceptions and explanations why it didnt work the last time.
then in your last post you say you needed to manually change ie falsify some data to get the results you wanted to get.
not to mention the wilmott site reputation.
LOL
------------------------------------------------
I think you didn't understand anything.
Make money by predicting financial data? Say me how to do it and I will do it for sure. Following your example: small engine-consultancy finding out a better way to perform the combustion processes should keep the secret to themselves and build from scratch the whole engine, isn't it? The answer to your (quite kiddish) statement is: specialisation. The program is for companies that know what to do, to offer them a better product. I don't know what to do I don't know what are the returns for!!!!!!!!
Sorry about the lots of the bugs in the wilmott's forum, I did everything on-the-go (too many things in parallel). Regarding the falsifiction I thought it was clear enough: the program gives a good result without considering the situation as instable or not; I am a human (a bit more intelligent than the algorithm), I understand what is going on and I make up a quick fixing to help the algorithm to tell the final user the whole picture more properly. All the problems you see in this forum are consequence from trying to model something the current version is not prepared for (negative numbers).
Save | Cancel
76.Hi Alvaro, I admire your courage and commitment.
I have been a marketer for most of my life, and I would like to make a suggestion to you. As you have noticed, the majority of the commenters are ignorant and self centered. They are unable to determine themselves what to use your product for. The solution to this is simplyfy. Package your product so a 10 year old can understand it(thats the intellectual level most are at). By this I mean divide your product into easy packages and sell them individually. Just like toothpaste companies divide their product into 15 varieties(toothpaste for kids,toothpaste with mouthwash, tartar control toothpaste etc etc…its all the same stuff basically with small changes, differet packaging and HIGHER pricing)
So in practical terms, create what the customers are looking for(sex and money). Create a product that is called”stock market analiser” and create an interface that “average joe” can input stock market data and get a prediction…explain what the pediction means. Sell that product for US$3000+, Create another product for Google analytics(massive market of peaple trying to make money), find out what number outputs the punters want and package it. Dedicated products for dedicated markets and you’ll be very wealthy.
All the best.
-------------------------------------------
Again a really useful advice. Many thanks.
Save | Cancel
73.In the next version I would suggest linking into Excel so the algorithm can run from a toolbar. The TrendBot program already opens its own input worksheet, Input would be essayer and so would a rerun of the data, that is if references to the cells were used to collect the data and not just the data itself. After the calculations are finished TrendBot already opens its own output worksheet. What could be better, all the Worksheets together in one workbook. This way of implementing the algorithm would eliminate the unneeded GUI interface that others are insisting on and the algorithm itself would remain machine code.
Oh and for the Open Office users, the tool bar would most likely work for them as well. I use both programs, Excel and Open Office Calc, they are sharing third party toolbars (ones written for excel) and the toolbars are working great, without errors.
Remember Microsoft started in a garage.
------------------------------------------------------
Excellent advice. I will get some info about how to implement it. Many thanks
Save | Cancel
72.Alvaro, as the person behind a high-tech product, I can understand your pride of achievement. However, to sell, a product must unfortunately fulfill other criteria than just usefulness.
As you can see from the comments in this forum, there are many reasons that a potential client may reject your product without giving it a fair trial. It’s not enough for a product to be high-tech, it must also LOOK high-tech. If it doesn’t, then the only customers you’ll have are these rather rare people that can see beyond the first impression and catch the glint of an outstanding product that’s worth further effort. That’s a sure way for you to go bankrupt. It really doesn’t help to tell people that they didn’t get the point, as you’ve been doing in this forum.
I haven’t tried your product, and am not qualified to do so, but it seems that it lacks in installation, interface and documentation. They might not seem as essential, but believe me that they have to be of good quality for your product to even be considered by potential clients. Marketing your product when it’s not in a shape to be marketed can cost you your market before it even exists.
Installation : The first introduction to your product, must be smooth and aesthetic. There are several free installers like Inno Setup and (my favorite) InstallJammer.
Interface: You must have a very good graphical interface, because you’re competing head-on against the masters of interface, namely Microsoft and Excel. Although Excel may not do what your product does, many customers will prefer an easy-to-use product rather than a strong product. Claiming to have done better than Microsoft is not a strong selling position. Your interface must be especially easy to use by beginners, because they will decide whether to buy or not while still being beginners. It’s only afterward that they will gain expertise in your product.
Documentation: same as for interface, documentation for beginners must be especially excellent. Advanced features must also be well documented, or there’s no point in having them at all.
If you feel that you must sell your product prematurely to produce cash-flow, and if this product is so excellent, you might instead try the consultancy business, using your own software to consult, or supplying services to consultants.
In any case, you have my best wishes and good luck in the future.
--------------------------------------------------------------
Thanks for advices. I am taking note.
Save | Cancel
71.Ok, I’m going to try a serious comment this time.
Trend Analysis is scary stuff. I worked for a developer tho actually did trend analysis for the auto industry. If you’re REALLY talking the kind of work that people with a Ph.D. in Statistical Analysis or similar do… it if fraught with liability. That’s right - companies sue if the trendline doesn’t wind up matching reality. They expect it to be an accurate picture of what’s going to happen if a set of variables points to “X”. GM is in the shape its in becaues they believed their trend analyzers more than their common sense. Trend is “consumers want more SUVs forever as long as gas stays over $3/gallon US). Build SUVs, Hummers, and Trucks.
Oops… the economy crashed and now Obama wants GM to build Eco-boxes and hybrids. Shouldn’t their trend analysis have seen this coming a mile away? Nope. Because they didn’t have the right set of variables plugged in. They were analyzing consumer demand, interest rates, oil prices… liddat. They missed the “US housing market implosion will bring down the global economy” piece of the puzzle.
It could be that this software retails for $1300 becaues the developer is paying huge errors by ommission and liability insurance premiums. Or it could be that they’re weeding out casual users by setting a high price point (Whick, BTW, is peanuts for this kind of software. We had a module that was $50,000 for the first seat. Whether or not that’s a good deal is all about what it will do for you
Roj
----------------------------------------------------------
This reference to the automotive industry is quite funny because I did actually work in this field. And actually, the original idea of building this program came from some problems I faced by carrying out my work (modelling emissions) and after doing some research about the existing methods and discovering that no acceptable alternative (for the purpouses I was looking for) was available in the existing literature. Funnier still is the fact that neither my bosses or the (really big engines) company our small consultancy was working for found this trend-finding work interesting at all (or better: interesting but somehow interesting and after lots pushing (it was not a clear idea at all in their minds)).
We were working on pollutants modelling, perhaps in other branches within the huge engine-related research the ideas are different, I don't know; want I can assure you is that I have created the whole algorithm completely by my own (from my experience, I locate the most important problems and I tried to solve them); I haven't read or followed a single technical paper at any point (well... just to learn from the errors of others).
Save | Cancel
70.Alvaro wrote:
>> The final fit is always polynomial (2th degree) but involving the combinations of all the variables raised at different exponents. Is this useful? Only way to test it: try the program (today you have a good opportunity).
If I understand correctly, the data is always fit to 2nd degree polynomial with N variables by minimizing some error metric (rms?).
Assuming what I understand is correct:
Whether the number of variables involved is quite small (two or less) or large, polynomial fits are limited in value. One application I do see is in Physics when a highly non-linear equation is approximated around a given point using second order polynomial approximations. Under such scenarios, I have only used first order polynomials.
Looking at the price, I got an impression that the tool could find the fit from a very large set of equations. If it really does that, it could be immensely useful. I frequently encounter numerical solutions of differential equations that does not seem to fit any simple equation (polynomial, exponential, log, gaussian). Knowing the equation that fits from a larger space than I could handle from my brain could be really useful. On the other hand, I do not think that is easy. (May even be an NP-complete problem.)
Unless my understanding if your tool is incorrect, I think it is wiser to tell the potential users what the tool does so that they can decide whether to try to solve their specific problem with it or not.
If fitting 2nd order polynomials with multiple variables, I personally would not pay $1000 plus.
________________________________________________________________
No, you haven't understood. It is a polynomial fit but OVER all the possible combinations (among variables raised to different exponents); that is: you have multiple (actually millions) x1=current combination and you treat it as the only independent variable. Result: all the possible combinations among all the different variables are being considering somehow with the additional "power" of being raised twice (to its corresponding exponent and to the one corresponding to the polynomial fit).
Why are you so keen on finding a stupid trick demonstrating that I am lying? TRY IT!!!!!!! Run the program and run in parallel a coventional polynomial fit and then you can share the results (how in the hell are you thinking that a simple polynomial regression can understand data!!! It is dumb! you have to give it the corresponding independing variables (just one)).
Your understanding of my program is incorrect.
Save | Cancel
wow... lots of work in front of me... from the beginning:
---------------------------------------------------------
65.Interesting offer and some informative comments. As a Clinical Science PhD student who has been using SAS 9.2, I don’t understand the comment from the publisher that “this can handle about to 10 independent variables”. I’m using a statistical model with 38 independent variables using SAS for an analysis of covariance (ANCOVA) and it’s not a big deal. Also, not being able to actually see how this program models your variables is saying you fully trust this software to process them the way you intend. Remember, any statistical program just processes numbers, it does nopt know the intention of the researcher. In SAS, you can run multiple tests and compare each data step to see what actually happened. I can’t imagine using a true statistical analysis program that does not allow me to see the code behind the analysis. SAS has similar built in macros like this program, but it always allows me to switch to a code view so I can see what the software actually did. To the publisher- you may want to keep your algorithms “secret”, but without a researcher being able to see how the data was handled, they are flying blind and can only hope that your software chose the right models despite not knowing what the researchers intent is for even looking at the data set. For this reason alone, I’d have to say, no thanks,
---------------------------------------------------------
" “this can handle about to 10 independent variables”. I’m using a statistical model with 38 independent variables using SAS for an analysis of covariance (ANOVA)" If you read some of the stuff I have recommended to read you woould understand the difference between 10 variables managed by trendingBot and 38 (or 100) with other indirect methods (ANOVA, for instance): you get a directly-applicable solution; the algorithm works on simplifying huge amounts of data offering you a simple response (that shouldn't be applied blindly in any case (first, think)).
There is no macros in this program (excel just for I/O system).
You are giving a good overview of the idea: we have experience, we try many things and offer an as-less-user-affectable program as possible.
Regarding the secret, after reading many comments here, I have to change my mind (actually, the most of the algorithm has been already revealed in different forums).
(if you are still there...) why not giving just a chance to it?
Save | Cancel
I can see uses for this software, I'm in the volunteer field and I can think of a few ways to use this in term of person and time management...I don't know if I can actually use this product in terms of what I'm thinking, but it definitely is a good offering, but has a bit of a learning curve to master....
Save | Cancel
Strange offering. So expensive and so poorly presented. Screenshots are just SILLY! Website is slickly made but little more than a circular maze, ultimately AVOIDING information and details.
The videos I tried to examine were long-winded, unrelenting series of quickfades causing only greater confusion(but with a snappy little featured tune. Too bad I wasn't looking for snappy-music downloads).
And then there's the price/value we are excused from paying...All I can do is stare at this and wonder who on earth WOULD pay for this?
I could install and try to learn how it could be of value, but seriously, developers should try to appreciate most end-users do NOT LIKE TO INSTALL MYSTERIOUS SOFTWARE. Nor should they.
Save | Cancel
THANK YOU ALL, for giving complex and knowledgeable comments. This is a real asset to those who are not into the "higher forms of Computer Users". I had no idea what this program was about or what it could do to help everyday computer users.
After reading all the knowledgeable comments, I understand I have no use for this program. However, I feel there are many analyst, mathematicians, and so on who may find this program to be exactly what they are looking for.
I admire the input from the program's creator. Although we have had several comments and help from other program creators, I do not remember one who was quite as proud and helpful as Alvaro.
As far as all the calls for Open Office products, there are other applications that are used by many of us. I use Jarte and have done so for several years. Of Course, I don't use spreadsheets, but I find Jarte to be much more user friendly than OO or some of the other Word Processors out there.
Thank you, GOATD, for keeping interesting and useful programs FREE for all who are excited to try them! You are all doing an excellent job. There are always going to be complainers, just take them with a grain of salt!
Thanks again!
Save | Cancel
From what I can glean from what I've read within these comments and some of the materials that have been cited as references, I gather that:
1. The output is in the form of an equation that is completely deterministic, without any estimate of predictive uncertainty. That is, no statistical prediction intervals for the output (dependent) variable.
2. Independent variables are assumed to be totally uncorrelated. (Correlations among independent variables can result in highly unstable models.)
3. It is unclear as to how TrendingBot "decides" when it has chosen "enough," but not "too many" independent variables. (One can increase R^2 simply by adding independent variables, but larger values of R^2 only mean better fit to existing data...it does NOT mean better predictive power. Indeed, parsimony in the number of independent variables and number of estimated parameters is a GOOD THING. That is, Occam's Razor applies: Use as many as needed to achieve good (predictive) results, but use no more.)
In the Statistics.pdf reference [ http://www.trendingit.com/docs/en/Theoretical_overview/1-Statistics.pdf ], it is stated that "no behaviour (no one worthy to be predicted) can be described by attending at a so low number of variables." Thus it seems that TrendingBot rejects the idea of parsimony.
4. In the same pdf document, it is admitted that TrendingBot cannot deal with stochasticity: 'trendingBot's result for any (stochastic) time series = "trend not found"'
5. As a general rule, if one is building a completely deterministic model (with all probabilities ignored), then one should first determine the model form. For example, in 1964, when DuPont wanted me to build a deterministic, predictive model of the output of "waste nylon" from a new manufacturing process, I went down to the factory floor, WATCHED, and ASKED the workers what they did and how they decided what values to put into their data sheets. [The industrial engineer, mechanical engineer, and foreman all were wrong about how the operation worked.] I then constructed a mathematical model based on how the process operated and how the data were determined. I then used the existing data to determine the parameters and checked to ensure that the model's input variable historical data generated the actual output variable historical data.
5. The aforementioned pdf document states:
5a. "although there are no essential differences between extrapolation and interpolation methods..." YES THERE IS: OOne interpolates between values, one extrapolates beyond existing values.
5b. In the section, "b-5 probability-related methods [randomness]," it is stated that "these methods do not predict future behaviours on the basis of past ones [effects on the dependent variable from variations in the independent one(s)], but the probability of an event [= invariant phenomenon = not describable as a result of the interaction between independent/dependent variables] to occur." This is not true. For many years I developed stochastic (probabilistic) models that predicted future values, WITH ESTIMATED PROBABILITIES OF OCCURRENCE or, more accurately, WITH PREDICTION INTERVALS for the predicted future values and associated PROBABILITIES that the predicted values would lie within the intervals.
Save | Cancel
Downloaded and installed without problem, but can´t really tell if my installation has been properly registered -- no way to tell. Hopefully.
This program looks really promising. FYI, I have Microsoft Excel installed, but the default program for spreadsheet is OOo, and it is configured to use .xls sheets... and the spreadsheet format which is the GUI for this program, didn't appear in Excel, --> but rather in OOo <--. Hopefully, the developer will step into this forum to explain this event, because I will eventually drop MS Excel in favor of OOo, and it'd be great that this TrendBot thing were fully compatible with OOo.
Developer: thanks!
GAOTD: thanks!
Save | Cancel
I just wanted to put in my two cents that I do not recall the developer of a software package ever taking such an involved role in the replies throughout the day as this company has. I hope they continue to improve and update their software and maybe we will see them here again.
Save | Cancel
Although I haven't posted a comment on GOTD for over a year, due to helping start a non-profit (charitable) organization, I'm going to complement Alvaro for his frequent posting's to the various comments made by others during the day. Alvaro, while I haven't had the opportunity to download and try out your software, I intend to do so after I complete this comment. I would also like to thank you for making your software available to the GOTD community.
As an engineer who has moved into technology/product development and marketing positions, I have occasionally used statistical analysis in the past to evaluate trends in various types of data. Although I have a working knowledge in this area, it does not approach that of the others who have commented above who have done this type of work professionally or academically. What I would like to say to to others who may read this, though, is that is that your approach to trend analysis appears to make what is usually a statistical pain (for a causal user) into something that may now become both useful and easy to accomplish.
There are many who may find your program very useful if they need to analyze data in order to discover a possible trend in it, whether for political, medical, economic, educational, marketing, or product development type of data. The ability to quickly discover a possible trend in data, and apply knowledge of that field to understanding it, without having to master the statistics to mechanically accomplish the analysis process, is something that could be very powerful for an average user. I personally intend to try out your software in analyzing data for some of our projects introducing new technology and business concepts into developing countries.
While I'll leave the technical analysis of your approach to others who have a more advanced knowledge of statistical methods, I will say that, as a former computer programmer, the use of FORTRAN as your language of choice for your software still makes as much sense today as it would have 20 years ago - FORTRAN is still a very widely used programming language for engineering, science, and math applications.
As a fellow entrepreneur, I will complement you for your willingness to participate in the dialog with those who come to this site, and to quickly respond to the various comments and questions that have been posted. I wish you well as you continue to improve your program and offer it for sale commercially. I hope that, as you come up with new versions, that you will continue to consider offering some variation of them here so that you may continue to gain useful feedback on what people think of your software, and what attributes they value in this type of application.
Save | Cancel
The developer's idea and application are good for its purpose but the positives are overshadowed by the lack of good presentation, website design, descriptions of features, documentation, and support.
Suggestions: Provide at least a basic outline in the text file that is with the prgram. Opening a text file to read the information in it and then finding only a link to a blog is annoying to say the least!
For a program whose full version has such a high price, I would advise using more formal terminology tham phrases such as "the whole thing." Perhaps this is am attempt to be humorous but humor is rather out of place im a high-end business oriented application.
The stated requirements for 1 to 2 Gb of memory and 5/10 Gb of empty hdd space are too large for many people's systems. Consider ways to reduce these requirements. Remember there are many MANY people running older slower systems with smaller hard drives. Remember too that many business people use laptops and most laptops hard drives are small compared to desktops of equivalent age.
The various exe, msi, and batch files sprinkled throughout the program's folders are confusing as to what app is supposed to be for what purpose.
The website has very simple sketchy info. On the "about us" page, the "more about us" link merely reloads the same page.
The idea of a yahoo group is good, but when there is no activity at all and only links to "yahoo answers" math pages on the group homepage, the overall impression it gives is negative.
I suggest you spend some time looking at examples of both good and bad site design at these links:
http://www.webpagesthatsuck.com/
http://www.killersites.com/
http://www.worstoftheweb.com/
Top Ten Mistakes in Web Design
http://www.useit.com/alertbox/9605.html
Usability 101: Introduction to Usability
http://www.useit.com/alertbox/20030825.html
Some changes in presentation, good documentation and usage instructions, and a group or forum that has activity of some kind, will do a lot to improve the impression this application and its developer site gives to the public.
Good luck!
Save | Cancel
I'm having a problem. I'm running Vista, downloaded and installed and activated application according to directions but on execution I see screen after screen of 'file not found' errors.
Although the description is sketchy, I'm intrigued. I'm a researcher and a SAS user. I'm disappointed that we are limited to 5 variables. I work with multivariate data, never with as few as 5 variables.
Save | Cancel
Well this offering opened my eyes up to a world of study which I wish I knew more about but I'm not sure where I would find the time. Nonetheless, I think it's great that GOTD offers software of all "types and uses" like this.
The primary reason for my comment though, is in response to the MS Office vs. OpenOffice compatibility argument. While OpenOffice may not have a larger user base than MS Office yet, anyone who wants to use a plug-in or compatible application for it can simply download and install it for free. The same can't be said for a MS Office only plug-in. Therefore, I think you expand your potential user base by programming for OpenOffice unless of course you need specific MS Office features to make it work. That being said...kudos to all developers like Alvaro for giving it serious consideration as the OpenOffice user base is not likely to contract especially in this recession. OTOH, if you can afford the full version of this software, you probably have already purchased MS Office anyway but it's still something for all add-on application programmers to consider.
Save | Cancel
Let me see if I understand the purpose of this program.
Get a relation between various related inputs of data with relation of 1 output of data. This generates a set of weights that can be used to predict a value.
If for example (a very simplified one) you want Z and have X and Y
predicted Z = wx * X + wy * Y
Your program calculates the possible weights based on the data and uses them to create a formula in excel for it.
One thing I do not understand, is why not give the option of use .csv as the input and export the formula in plain text to the clipboard. That way it can be used not only in OpenOffice, but on any spreadsheet. Or even on a web page.
Save | Cancel
Alvaro,
Thank you for providing the program today. I loaded it, and ran it, but have not used it yet to see how it would best apply to me. However, I do realize that it has terrific potential, and look forward to having the time to diving into it. A program like this is not for everyone, and it doesn't have to be. For those people, they can move on, look forward to screen savers, or do whatever else. I just hope that they don't make it more difficult for GOTD to be able to provide this service for users like us. Most of the programs given away here do not apply to me. I am not going to argue about them, or degrade them. I will only comment how I feel my views might be relevant. Just wish more people felt that way. Thanks again.
Save | Cancel
Alvaro, biggest question is if your system works and predicts correctly e.g. financial data, why dont you just shut up, keep this to yourself and make billions on the stock markets, rather than trying to sell software for $1000?
i checked the wilmott site too. it is not at all convincing, but rather a history of newly found bugs and exceptions and explanations why it didnt work the last time.
then in your last post you say you needed to manually change ie falsify some data to get the results you wanted to get.
not to mention the wilmott site reputation.
LOL
Save | Cancel
Alvaro....BRAVO...BRAVO...BRAVO...8)
you are most patient and kind to respond as you have...8)
I am impressed beyond words...8)
GOTD...nice change of pace...it's great to see the depth of the acedemic community to your offerings...8)
looks like you are really reaching a great audience!
Rakos
Save | Cancel
For all the Open Office fanatics here. Yes Open Office is a free and great software. However, be aware that people who can afford to buy the software being offered here today, are not going to be users of Open Office, they probably own the latest M$ Office.
Save | Cancel
Alvaro - Never mind, I poked around a bit and found your forum. !Mil Gracias!
Save | Cancel
On a lighter note....If we put all the winning lottery numbers into TrendingBot, would the solution give us the winning lottery combination for this coming weekend? :o)
Save | Cancel
Sounds like something that wouldn't be much use for personal use. Sounds like it would be for business. As this software is only to be downloaded for personal use on this site, I don't believe a lot of people could use it.
Save | Cancel
Wow... I've been looking for something like this.
Thank you Alvaro, I don't know if there's a forum for Trendingbot available, but this looks like it could be exactly what I've been looking for.
If you could, shoot me an email to dnarby at gmail dot com . I think you might be missing the big picture with regards to what you could do with this (hint: It's not retailing the software). ; )
Save | Cancel
Hi Alvaro, I admire your courage and commitment.
I have been a marketer for most of my life, and I would like to make a suggestion to you. As you have noticed, the majority of the commenters are ignorant and self centered. They are unable to determine themselves what to use your product for. The solution to this is simplyfy. Package your product so a 10 year old can understand it(thats the intellectual level most are at). By this I mean divide your product into easy packages and sell them individually. Just like toothpaste companies divide their product into 15 varieties(toothpaste for kids,toothpaste with mouthwash, tartar control toothpaste etc etc...its all the same stuff basically with small changes, differet packaging and HIGHER pricing)
So in practical terms, create what the customers are looking for(sex and money). Create a product that is called"stock market analiser" and create an interface that "average joe" can input stock market data and get a prediction...explain what the pediction means. Sell that product for US$3000+, Create another product for Google analytics(massive market of peaple trying to make money), find out what number outputs the punters want and package it. Dedicated products for dedicated markets and you'll be very wealthy.
All the best.
Save | Cancel
Ah...the OpenOffice/"real" Office compatability issue strikes again. It would seem to me, with all of the analytical minds contributing to this forum today, that some logic should find it's way into the conversation.
I will make my point exceedingly clear...
The onus for compatability lies in the lap of the developers of OpenOffice; not the authors of the application offered here. Since OpenOffice claims compatability with the "real" Office, then any add-in, plug-in or stand-beside that functions with one should work equally well with the other. But this is simply not the case. I find it quite humorous that proponents of such open-source software would continue to use an app that makes false claims. OpenOffice is only compatable with certain aspects of Microsoft's stellar, award-winning productivity software. It falls short in more ways than can be listed...actually the only thing in it's favor is the cost of ownership...but even then the shortcomings outweigh the benefits.
My hat is off to GOTD for keeping their offerings well-rounded and useful. Whether an offering is a "Lite", "Abridged" or "Full" version, it's always free here. One shouldn't complain about that. Thanks again folks!
Save | Cancel
Hey Phil, #20 - maybe you should use the internet to learn about different cultures and you would know that analyze is the American spelling, and analyse is the European spelling.
Save | Cancel
In the next version I would suggest linking into Excel so the algorithm can run from a toolbar. The TrendBot program already opens its own input worksheet, Input would be essayer and so would a rerun of the data, that is if references to the cells were used to collect the data and not just the data itself. After the calculations are finished TrendBot already opens its own output worksheet. What could be better, all the Worksheets together in one workbook. This way of implementing the algorithm would eliminate the unneeded GUI interface that others are insisting on and the algorithm itself would remain machine code.
Oh and for the Open Office users, the tool bar would most likely work for them as well. I use both programs, Excel and Open Office Calc, they are sharing third party toolbars (ones written for excel) and the toolbars are working great, without errors.
Remember Microsoft started in a garage.
Save | Cancel
Alvaro, as the person behind a high-tech product, I can understand your pride of achievement. However, to sell, a product must unfortunately fulfill other criteria than just usefulness.
As you can see from the comments in this forum, there are many reasons that a potential client may reject your product without giving it a fair trial. It's not enough for a product to be high-tech, it must also LOOK high-tech. If it doesn't, then the only customers you'll have are these rather rare people that can see beyond the first impression and catch the glint of an outstanding product that's worth further effort. That's a sure way for you to go bankrupt. It really doesn't help to tell people that they didn't get the point, as you've been doing in this forum.
I haven't tried your product, and am not qualified to do so, but it seems that it lacks in installation, interface and documentation. They might not seem as essential, but believe me that they have to be of good quality for your product to even be considered by potential clients. Marketing your product when it's not in a shape to be marketed can cost you your market before it even exists.
Installation : The first introduction to your product, must be smooth and aesthetic. There are several free installers like Inno Setup and (my favorite) InstallJammer.
Interface: You must have a very good graphical interface, because you're competing head-on against the masters of interface, namely Microsoft and Excel. Although Excel may not do what your product does, many customers will prefer an easy-to-use product rather than a strong product. Claiming to have done better than Microsoft is not a strong selling position. Your interface must be especially easy to use by beginners, because they will decide whether to buy or not while still being beginners. It's only afterward that they will gain expertise in your product.
Documentation: same as for interface, documentation for beginners must be especially excellent. Advanced features must also be well documented, or there's no point in having them at all.
If you feel that you must sell your product prematurely to produce cash-flow, and if this product is so excellent, you might instead try the consultancy business, using your own software to consult, or supplying services to consultants.
In any case, you have my best wishes and good luck in the future.
Save | Cancel
Ok, I'm going to try a serious comment this time.
Trend Analysis is scary stuff. I worked for a developer tho actually did trend analysis for the auto industry. If you're REALLY talking the kind of work that people with a Ph.D. in Statistical Analysis or similar do... it if fraught with liability. That's right - companies sue if the trendline doesn't wind up matching reality. They expect it to be an accurate picture of what's going to happen if a set of variables points to "X". GM is in the shape its in becaues they believed their trend analyzers more than their common sense. Trend is "consumers want more SUVs forever as long as gas stays over $3/gallon US). Build SUVs, Hummers, and Trucks.
Oops... the economy crashed and now Obama wants GM to build Eco-boxes and hybrids. Shouldn't their trend analysis have seen this coming a mile away? Nope. Because they didn't have the right set of variables plugged in. They were analyzing consumer demand, interest rates, oil prices... liddat. They missed the "US housing market implosion will bring down the global economy" piece of the puzzle.
It could be that this software retails for $1300 becaues the developer is paying huge errors by ommission and liability insurance premiums. Or it could be that they're weeding out casual users by setting a high price point (Whick, BTW, is peanuts for this kind of software. We had a module that was $50,000 for the first seat. Whether or not that's a good deal is all about what it will do for you
Roj
Save | Cancel
Alvaro wrote:
>> The final fit is always polynomial (2th degree) but involving the combinations of all the variables raised at different exponents. Is this useful? Only way to test it: try the program (today you have a good opportunity).
If I understand correctly, the data is always fit to 2nd degree polynomial with N variables by minimizing some error metric (rms?).
Assuming what I understand is correct:
Whether the number of variables involved is quite small (two or less) or large, polynomial fits are limited in value. One application I do see is in Physics when a highly non-linear equation is approximated around a given point using second order polynomial approximations. Under such scenarios, I have only used first order polynomials.
Looking at the price, I got an impression that the tool could find the fit from a very large set of equations. If it really does that, it could be immensely useful. I frequently encounter numerical solutions of differential equations that does not seem to fit any simple equation (polynomial, exponential, log, gaussian). Knowing the equation that fits from a larger space than I could handle from my brain could be really useful. On the other hand, I do not think that is easy. (May even be an NP-complete problem.)
Unless my understanding if your tool is incorrect, I think it is wiser to tell the potential users what the tool does so that they can decide whether to try to solve their specific problem with it or not.
If fitting 2nd order polynomials with multiple variables, I personally would not pay $1000 plus.
Save | Cancel
I am leaving now. I will answer all your questions tomorrow morning (it would be ideal if you would use the contact form from our webpage)
Save | Cancel
Fubar (62), right now I am damm tired and am not feeling like going there and discussing about these theories (in the forum I am announcing, some people propose various alternatives); from my experience, I would say that these approaches are completely different (but, logically, I can not conclude anything after reading them). These type of intensive regression methods rely on combinatorics but in a different part where trendingBot does: they use to respect the limitation of 2 independent variables for regression methods by letting all the values constant except one at every step (= reducing the total number of independent variable to just one).
The main difference between all these approaches (I do insist that not sure about some of the ones you mentioned) and trendingBot is that they use to "account for everything within the given path" = the path taken is really narrow (no exponential variations, all the variables remaining constant, etc.); on the other hand, our approach is a bit more "casual", it takes a more practical path (much wider than the one taken by the most of the formal mathematical theories) on exchange of "not accounting for everything", just for the most useful parts.
It is a bit difficult to speak about all this is general terms (I am still resisting to reveal the whole recipe), that's why I am coming always to the same conclusion: try it; it is surprisingly effective.
Nevertheless, if you have interest in all this, you could read some documents analysing (although not in depth) all the existing forecasting methods: http://www.trendingit.com/docs/en/Theoretical_overview/
Save | Cancel
George Ducas (#61), I am not sure if I have understood you. Once the equation is created, the resulting data (after applying it) are erroneous by definition (there is always some error level). I assume you are referring to some kind of feed-back: learning from the errors after applying the fit in a systatic way (any simple program can do such a thing: just giving values to the variables) and redoing somehow the fit. But this is already being done for the training set (the chose equation is the best one out of millions and the standard to fix this goodness is precisely by comparing its performance against the available data (the trainin set)).
Regarding this part of "Is this the beginning of robotic software, where the program actually runs analysis" note that this is the underlying idea to any forecasting method: finding the way that a mathematical algorithm can "understand data" and hence being capable to replicate this understanding in the future, predicting. One of the most active fields working on all this is "machine learning", a branch of computational theory focusing on this issue: teaching computers (but this is just all the same thing: understanding data in a mathematical way)
Save | Cancel
While researching this, I ran across some interesting software lists (the serious kind, not the usual freeware/shareware sites). Here are some free statistical packages, one which includes some of the serious commercial statistical software, one which includes mostly free statistical software packages for the behavioral sciences, the Mathematics Virtual Library, and another interesting list of commercial and free mathematical software.
Save | Cancel
Interesting offer and some informative comments. As a Clinical Science PhD student who has been using SAS 9.2, I don't understand the comment from the publisher that "this can handle about to 10 independent variables". I'm using a statistical model with 38 independent variables using SAS for an analysis of covariance (ANCOVA) and it's not a big deal. Also, not being able to actually see how this program models your variables is saying you fully trust this software to process them the way you intend. Remember, any statistical program just processes numbers, it does nopt know the intention of the researcher. In SAS, you can run multiple tests and compare each data step to see what actually happened. I can't imagine using a true statistical analysis program that does not allow me to see the code behind the analysis. SAS has similar built in macros like this program, but it always allows me to switch to a code view so I can see what the software actually did. To the publisher- you may want to keep your algorithms "secret", but without a researcher being able to see how the data was handled, they are flying blind and can only hope that your software chose the right models despite not knowing what the researchers intent is for even looking at the data set. For this reason alone, I'd have to say, no thanks,
Save | Cancel
thanks again for all these nice words.
Aniruddh you have to take some historical data (as recent as possible) and:
1. Locate the dependent variable (what you want to predict) -> outputs
2. Locate the (independent) variables that you think that affect the most the behavour of the previous one (you can chose just 5) -> inputs
3. Introduce as much training as possible -> 60 cases (60 days, months... where the varibles take different values).
4. Run the program
5. Trend and error below than 5% (for at least 30 cases of training)? The predictions will be quite reliable (although you should rely always on the common sense).
How to do this with google analytics? (Completely random) example
1. Total number of visitors
2. var1 (number of visitors during the previous day), Var2 (number of links to your page the previous day), var3(number of persons buying something from your page the previous day), var4(new inclusion in your webpage yes/no (1/2)), var5 (time spent by every user the previous day).
3. Take as much historical values for the aforementioned variables as you can (the last 2 months, for example).
4. run.
5. "no trend" => try a different set (the time spent by user the previous day perhaps was an horrible idea); for example, number of returning visitors the previous day (who returns twice tends to come back at the next day). Trend showing a 2% error (= after being applied to the data you provided the previsions where matching the 98% of the cases)? Excellent news: you can (somehow... always the common sense before the numbers) rely on these predictions. By introducing the chosen variable (finally, it was the number of returning visitors during the previous day) to would have a much better idea about what most probably would happen.
This example is not marvellous (I don't know how important is predictiing the number of visitors during the next day) but gives a clear enough picture about how to deal with the program (I think).
Save | Cancel